When a team understands growth, everything falls in to place.” – Erik Starck


The Lean Growth Canvas
The Lean Growth Canvas helps agile teams focus their efforts on activities that lead to growth.
With our Growth Program you will learn how to set up a growth team and work systematically with growth using the canvas. Contact us to get started.
The video below gives a short overview of the Lean Growth Canvas.
We are fans of the Pirate Metrics for Startups Model (AARRR) presented by Dave McClure a few years ago. The model helps with growth by highlighting the critical parts of the user funnel. It consists of five steps:
- Acquisition. How the product reaches its audience and gets traffic.
- Activation. How a visitor turns in to a user.
- Retention. To what extent users come back to the product.
- Referral. To what extent users share the product, in order words the viral factor of the product.
- Revenue. How the app makes money.
This is a good model for understanding how growth happens. Based on this, we built a tool that a team that’s working with growth in a lean environment can use in their day to day operation. We call it the Lean Growth Canvas.
It is meant to be used as you would use a scrum board or a Business Model Canvas: up on the wall where everyone in the team can see it and with post-it notes or whiteboard pens for making quick edits and changes.
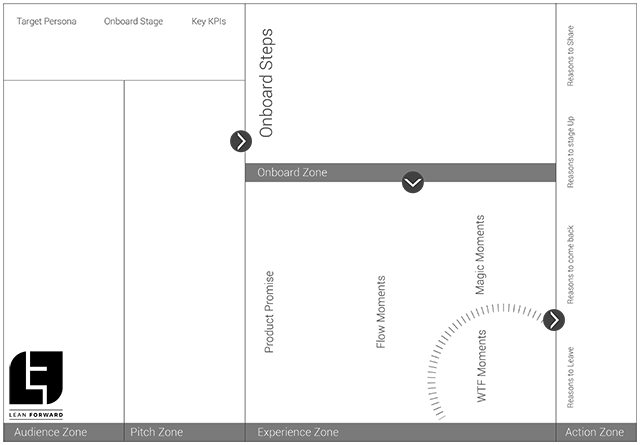
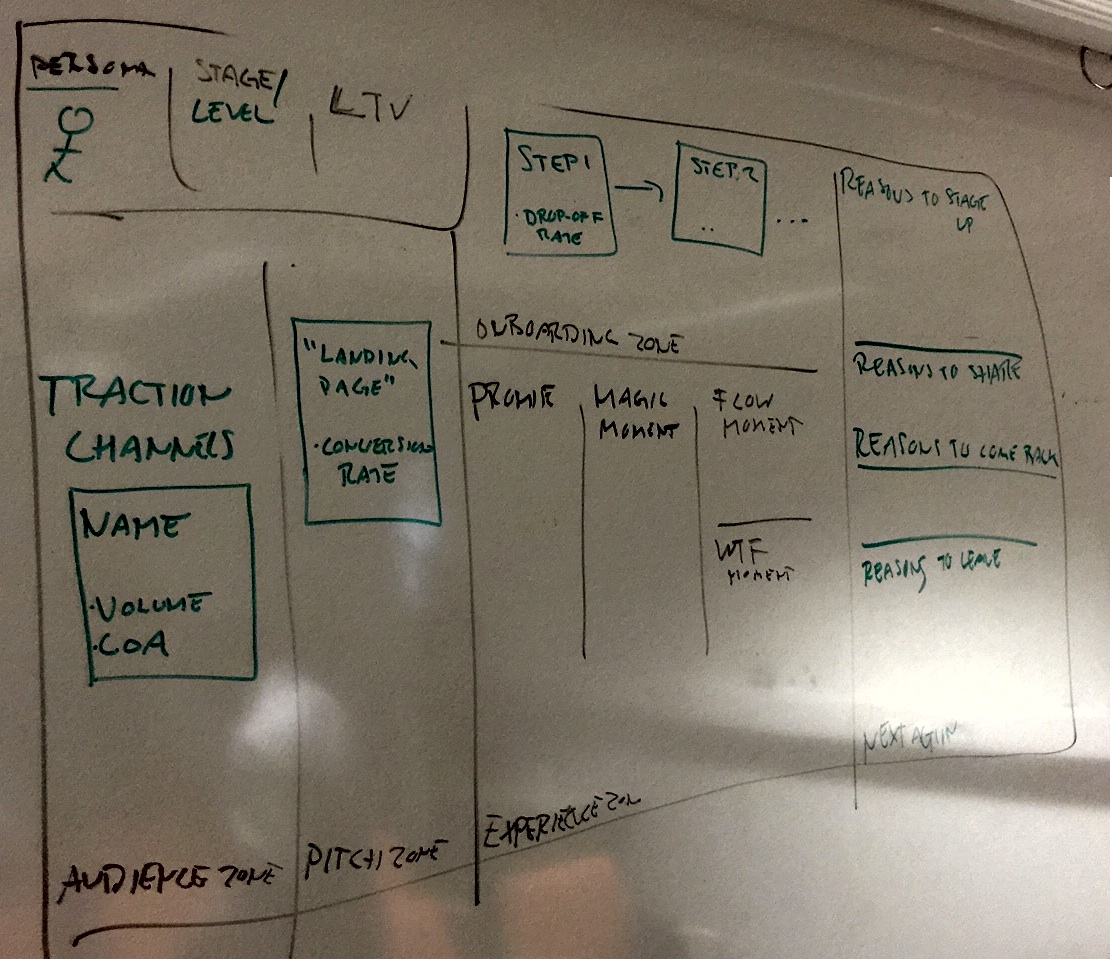
As you can see, the canvas is split into different zones, each one roughly mapping to one of the funnel stages in the AARRR-model. In the upper left corner you write:
- Persona or market segment. You can potentially have multiple growth canvases for different personas but anyway it’s good to put a picture or a name of a proto persona to make is visible to the team.
- Onboard stage or commitment stage. Most apps have some sort of “commitment ladder”. Perhaps you have a freemium and a premium version of your product? Many social apps follow the 90/9/1-distribution of users, with 90% of the users as readers or “lurkers”, 9% as contributors and 1% as heavy creators. Sometimes the experience of using the app is so different for different stages that you may need multiple growth canvases but if not, simply make a note of the different stages here.
- Key KPI. I recommend you try to calculate the Lifetime Value of a customer and put it here but you may have other KPIs. How much is one user worth? Put that number here. If necessary, put one value for each user stage as described above.
The Growth Zones
The zones are:
- Audience zone. In this area, each of the relevant traction channels are listed with a volume and a cost of acquisition (per visitor) on each channel. For an excellent overview of different traction channels, read the book Traction by Gabriel Weinberg and Justin Mares. In it they list no less than 18 different traction channels.
- Pitch zone. This is where you have to convince the visitor to become a user. Typically this would include landing pages, app store descriptions, banners, ads or even in-app splash screens or signup forms. Here you list all the pitches with a conversion rate on each one.
- Onboarding zone. Here you list all the steps that a visitor goes through to become a user, with a drop-off rate for each step. Note that there may be days, even weeks, between the steps, it all depends on your onboarding process and how you determine the path a visitor has to take to become a user.
- Experience zone. This zone is about the “inside the app”-experience. Now you’re getting to the core of the product. This zone is split in to four subareas:
- Promise. This is a one sentence description of what you promise the user will happen when they use the product. There may be more than one promise but having multiple product promises is a sure sign your product is too complex and it will be hard to communicate the core value proposition to an audience. What should you measure? This one is tricky. This is essentially how well you succeed in living up to the users expectations so measurements such as Net Promoter Score or app store ratings are suitable to track this.
- Magic moments. This is the moment when the value of the product becomes utterly clear to the user. This may be even harder to test than the product promise, but its at least good for the team to discuss what the magic moments in the product can be and have it clearly stated on a growth canvas on the wall. Read more about magic moments here. They are sometimes called Aha-moments (although there is a subtle difference).
- Flow moments. The flow moments are “regular, repetitive, predictable tasks” that are handed “to users in the most transparent and convenient way possible”. In other words: features that keep the user “in the flow” of your product. The things that keep them in your app, on your website etc. Typical examples would be the “Related content” section on a Facebook post or how the twitter feed updates while the user is reading her tweets. Put the most important ones (based on first your guesses and then data from user behavior) on the growth canvas and keep track of retention per feature and face time.
- WTF moments. The dark side of the growth canvas is where you list the illogical features, the strange behaviors, the poor user interface and everything else that just leaves the user scratching her head. Data to look for: features with extremely poor retention or features that leads to the user leaving the product.

- Next-Action zone. This is where you list the reasons for the user to keep a relationship with your product. There are four fields in this zone:
- Reasons to stage up. Here you list why a user should “stage up”, that is, become a more committed user. See above for a definition of stage. Data to look for: usage of features or customer surveys.
- Reasons to share. Having a viral product can lead to hyper growth. That’s why it’s good to track the reasons the user have to invite friends, share content, talk about your product, recommend it etc. Data to look for: depends on how your product is built. What are the “social objects”, what are the viral mechanisms? Maybe your product doesn’t have any viral mechanism, then this would also be a good place to list stories you want your users to tell each other about your product. Stuff to read: Made to Stick.
- Reasons to come back. Here you list your strongest retention drivers. How do you get your users hooked. There’s a book by Nir Eyal with just that name that tells you everything you need to know about building habits around your offering: Hooked.
- Reasons to leave. Why do people not come back? Are your competitors better? Are you solving the wrong problem (the wrong Product Promise, see above)? List your suspected reasons for users not to come back and try to get the facts for each reason.
That’s the Lean Growth Canvas in its entirety. The picture to the right shows what it can look like on a whiteboard.
Working with the Lean Growth Canvas
Use it as a tool to find the One Metric That Matters and where to target your growth hacking experiments. Just remember to back the canvas up with data. The canvas is a way to avoid “data vomit” and help you manage your metrics and it should be used together with a powerful analytics engine such as KISSMetrics, MixPanel or Google Analytics, preferably in an agile work environment such as Scrum.
You can also use the canvas as the center of a Lean Marketing organisation, just make sure to have the product developers near.
Here is a simple process you can follow:
- Start by filling the canvas with yellow post-it notes, each with a description and a metric as described above. Get the latest metrics from your analytics tool.
- Discuss which zone is the most important to focus on. Hint: before product/market fit, focus on retention driving features.
- Then add green post-it notes to that zone and write down something you want to experiment with plus an expected outcome of the experiment. For example, in the Flow Moments-section you add a note saying “add ‘explore similar content’ to post view” and the expected impact on session length.
- Now you have yellow post-its representing the current state and green post-its representing potential experimental changes.
- Implement the best experiment (highest impact, least effort).
- Repeat daily or weekly (depending on your delivery cycle speed).
That’s it. Very simple and fits perfectly with an up-and-running scrum team.
Want a clean, nice PNG of the Lean Growth Canvas? It’s right here:
Download a PNG of the Lean Growth Canvas.
Lean Forward wants entrepreneurs and enterprises to innovate and grow with minimum waste and risk. We can help you get started working with the Lean Growth Canvas in your organisation. Give us a call or send us an email and let’s talk!.